Candlestick patterns can help forecast future price movements. Explore the 16 most common candlestick patterns and learn how to use them to spot potential trading opportunities.
What is a candlestick?
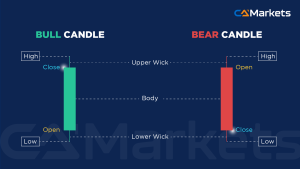
A candlestick chart is a type of chart used in technical analysis to show an asset’s price movement over a specific period. Each candlestick provides four key pieces of information for that period:
Open price: the price of the asset’s first trade at the beginning of the period.
Close price: the price of the asset’s last trade at the end of the period.
High price: the highest price reached during the period.
Low price: the lowest price reached during the period.
A candlestick consists of the “body” and the “wick” (or “shadow”). The body shows the range between the open and close, while the wick shows the high and low. If the close is above the open, the body is typically filled with a light color (often white or green), indicating a bullish move. If the close is below the open, the body is darker (often black or red), indicating a bearish move.
Six bullish candlestick patterns
Bullish patterns often appear after a downtrend and suggest that price action may be about to reverse. These patterns can serve as signals for traders to consider opening long positions, anticipating an upward trajectory and potential profits.
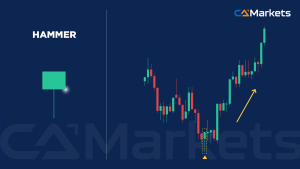
1. Hammer
The hammer candlestick is characterized by a small body, a long lower wick, and little to no upper wick. In a downtrend, a hammer often signals exhaustion and suggests a potential bullish reversal.
In the hammer pattern, sellers push price to new intraday lows but fail to keep it there. Buyers step in and drive price back up, so the market closes near or above the open. If the hammer is red (bearish), it indicates the market closes slightly below the open. Conversely, if the hammer is green (bullish) and closes above the open, the reversal signal is stronger.
To qualify as a hammer, the lower wick should be at least two to three times the length of the body.
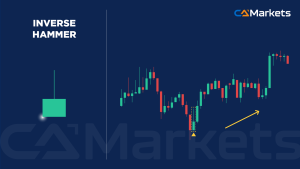
2. Inverted Hammer
The inverted hammer is essentially the opposite of the hammer. It has a small body, a long upper wick, and little to no lower wick.
In this pattern, buyers (bulls) initially push price higher during a downtrend and gain early control. However, the move doesn’t hold, and sellers (bears) step in, pushing price back down so it closes near the open. Even so, bears still fail to sustain the decline, which may signal a shift in upward momentum.
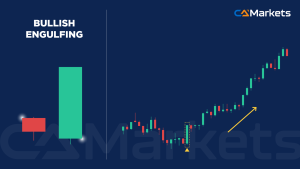
3. Bullish Engulfing
The bullish engulfing candlestick pattern consists of two candles. The first is a red bearish candle that forms during a downtrend.
After that bearish candle, a green bullish candle forms and completely engulfs the previous candle. This indicates that buyers stepped in aggressively, driving price up from the prior candle’s close and ultimately closing above the prior candle’s high.
By the end of this pattern, the market should close at or near the top of the period, with little to no wicks on the bullish candle. This suggests strong buying momentum and a potential reversal of the downtrend.
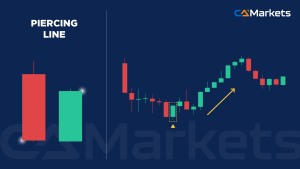
4. Piercing Line
The piercing line pattern is similar to the bullish engulfing pattern but has distinctive characteristics that suggest a potential market reversal. It consists of two candles: a red bearish candle and a green bullish candle.
In the piercing line pattern, the bearish candle has a long body and is not fully engulfed by the bullish candle. Typically, there is a gap between the bearish candle’s close and the bullish candle’s open, and the bullish candle closes above the midpoint of the bearish candle.
This pattern signals a reversal: bears initially control the market, but by mid-way through the second session, bulls take over and push prices higher.
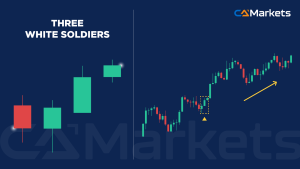
5. Three White Soldiers
After a clear downtrend, the three white soldiers pattern signals a strong reversal. It consists of three consecutive green or white bullish candles.
For the pattern to be valid:
The first bullish candle should close within the range of the previous red bearish candle.
The second bullish candle should close above the bearish candle’s open.
The third bullish candle should close above the second bullish candle’s close.
Each of the three candles should show progressively longer bodies, reflecting increasing buying momentum. This pattern strongly suggests the downtrend is reversing into an uptrend.
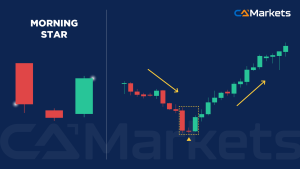
6. Morning Star
The morning star pattern is an important signal that a downtrend may be about to reverse. This candlestick pattern consists of three different candles:
First candle: a long red candle, representing the continuation of the downtrend.
Second candle: a small-bodied doji or spinning-top candle. The candle’s color (bullish or bearish) is not important; what matters is that it is small. This candle often appears in the gap between the first and third candles.
Third candle: a long green bullish candle that follows the doji or spinning top.
The morning star indicates that although sellers initially dominated, they were unable to maintain the downtrend. The appearance of a long bullish candle suggests buyers are taking control, signaling a potential shift to an uptrend.
Six bearish candlestick patterns
After covering the six most common bullish candlestick patterns, let’s explore six bearish candlestick patterns. When the market is in an uptrend, these patterns can signal a potential reversal.
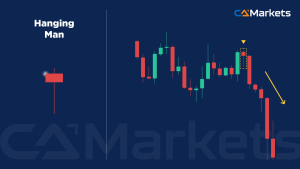
1. Hanging Man
The hanging man pattern is similar to the hammer, but it appears after an uptrend. Like the hammer, it signals a potential reversal—this time from an uptrend to a possible downtrend.
In this pattern, sellers drive the asset’s price lower during the session, but buyers step in and push it back up. Despite the rebound, buyers fail to sustain the upward momentum, suggesting control may be shifting to sellers and a decline could be imminent.
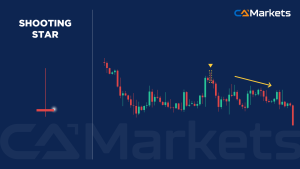
2. Shooting Star
The shooting star pattern is a key indicator of a potential market reversal. It is similar to the hanging man, but inverted. Instead of a small body with a long lower wick, the shooting star features a long upper wick and a small body near the bottom.
Similar to the inverted hammer discussed earlier, the shooting star reflects sellers pushing back after an initial upward move. When it appears at the top of an uptrend, it suggests momentum may be shifting and the market could reverse into a downtrend.
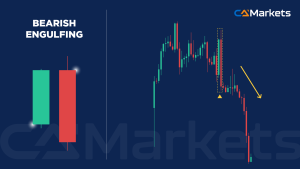
3. Bearish Engulfing
The bearish engulfing pattern is the opposite of the bullish engulfing pattern. In this case, the second red bearish candle completely engulfs the first green bullish candle.
After the first bullish candle closes, the market opens higher in the next session, but quickly falls as sellers take control. The second candle’s body should be larger and cover the entire range of the first candle.
As selling pressure increases and supply outweighs demand, it signals a possible shift into a downtrend. Like the bullish engulfing pattern, the second candle often has little to no wicks.
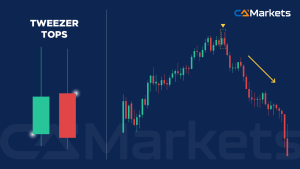
4. Tweezer Tops
The tweezer tops pattern consists of two consecutive candles and is a bearish reversal signal. The first candle is a green bullish candle, and the second is a red bearish candle. Both candles typically have short bodies and long wicks.
In the tweezer tops pattern, the upper wicks of both candles should reach the same level, creating a symmetrical appearance. This indicates buyers tried twice to push the market to new highs but failed, as the market pulls back to the first candle’s open by the close of the second candle.
The wick alignment and the failure to sustain higher prices suggest momentum may be shifting, indicating a downtrend could be approaching.
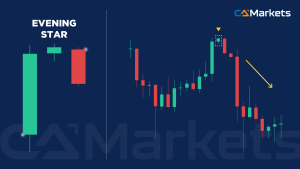
5. Evening Star
The evening star pattern is similar to the morning star, but it signals a potential bearish reversal. It consists of three candles:
First candle: a long green bullish candle, indicating the uptrend continues.
Second candle: a small doji or spinning-top candle, representing market indecision. The color matters less than its small size. This candle should gap away from both the first and third candles at the open and close.
Third candle : a long red bearish candle that confirms the reversal.
In the evening star pattern, the first candle shows strong buying momentum, but as the second candle forms, momentum stalls, indicating hesitation or a pause. By the third candle, the market typically begins to pull back as sellers take control. As more traders close long positions and open short positions, the market may enter a downtrend.
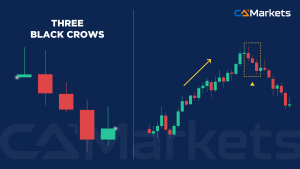
6. Three Black Crows
The three black crows pattern is similar to the three white soldiers pattern, but it signals a bearish reversal. Instead of three consecutive bullish candles, it features three consecutive bearish candles, suggesting the market may shift downward.
For the pattern to be valid:
First candle: a bearish candle that closes within the range of the previous green bullish candle.
Second candle: a bearish candle that closes below the open of the previous bullish candle.
Third candle: a bearish candle that closes below the close of the second bearish candle.
Each of the three bearish candles should have progressively longer bodies, reflecting increasing selling momentum. This pattern strongly suggests the market is about to reverse to the downside.
Four continuation candlestick patterns
The following candlestick patterns are known as continuation patterns. Unlike reversal patterns, these do not indicate a change in market direction, but they can help traders identify periods of consolidation or indecision.
During these phases, the market may appear hesitant, suggesting it could continue in the current trend. However, it’s important to remember that markets are unpredictable, especially during high-volatility periods.
Here are four of the most common continuation patterns:
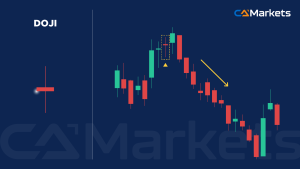
1. Doji
Doji candles are easy to recognize: they resemble a cross, with a very small or nearly non-existent body. The wicks on either side may vary in length, but they are typically relatively short.
The defining feature of a doji is its minimal body, indicating a balance between buyers and sellers, with neither side gaining control. The open and close are nearly the same, reflecting market indecision.
While a single doji signals uncertainty, when combined with other candles it can form reversal patterns, such as the evening star and the morning star.
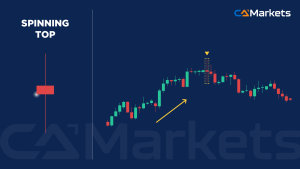
2. Spinning Top
The spinning top pattern consists of candles with small bodies and wicks of similar length. This pattern shows a tug-of-war between buyers and sellers, with neither side gaining an advantage as price closes near the open level.
Spinning tops often appear after a strong uptrend or downtrend, signaling the market may enter a consolidation phase. It can suggest the current trend may continue as the market “takes a breath.” Alternatively, if it appears at the peak of an uptrend or the bottom of a downtrend, it may signal a potential reversal.
This pattern reflects a balance of power between buyers and sellers, indicating one side may be losing control and hinting that market direction could be changing.
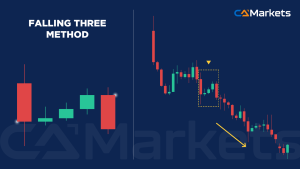
3. Falling Three Methods
This candlestick pattern is also known as three inside up or three outside down. It consists of five candles and indicates that the current market trend may continue.
Here’s how it unfolds:
First candle: a long red bearish candle, indicating the downtrend continues.
Second to fourth candles: three smaller green bullish candles that form within the range of the initial bearish candle.
Fifth candle: a long red bearish candle that closes below the low of the first bearish candle.
This pattern shows buyers attempted to push prices higher, but lacked the strength to sustain the move. Sellers regained control and pushed prices lower again, reinforcing the existing downtrend.
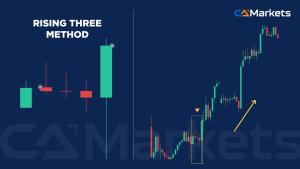
4. Rising Three Methods
The rising three methods pattern is similar to the falling three methods pattern. It appears in an uptrend and consists of five candles in sequence.
Here’s how it works:
First candle: a long green bullish candle, indicating the uptrend continues.
Second to fourth candles: three smaller red bearish candles that form within the range of the initial bullish candle.
Fifth candle: another long green bullish candle that closes above the high of the first bullish candle.
This pattern indicates that while sellers briefly tried to push prices lower, they lacked the strength to sustain the move. Buyers then drove prices back up, reinforcing the uptrend.
Are candlestick patterns reliable in trading?
Traders use candlestick patterns to guide their buy and sell decisions and to determine when to take profits or reduce losses. While no analysis or pattern is foolproof, many traders find candlestick patterns to be a valuable tool.
To maximize effectiveness, traders should follow established criteria and wait for confirmation before entering a trade. It is commonly recommended to wait until the candlestick closes before making a decision.
Candlestick patterns are designed to provide insight into potential market moves, helping traders anticipate trends and manage the risk of missing opportunities or entering unfavorable trades.
Candlestick patterns on higher timeframes (such as daily or four-hour charts) tend to be more reliable than those on shorter timeframes (such as 15-minute or 5-minute charts).
For best results, practice reading candlestick patterns using a demo account, and consider other factors that align with your trading style and goals.


 Earn a stable income by referring clients to our platform. As a partner, you will become an integral part of our network, leveraging our renowned brand and comprehensive financial services to attract new clients. Our partner program is designed for mutual benefit, offering an attractive commission structure and rewards for every client you refer.